Group 1 Definition and Example
The reports from Group 1 include the following specific reports. Each will provide a detailed explanation of what information the report provides.
Included Reports
The reports from Group 1 include the following specific reports. Each will provide a detailed explanation of what information the report provides.
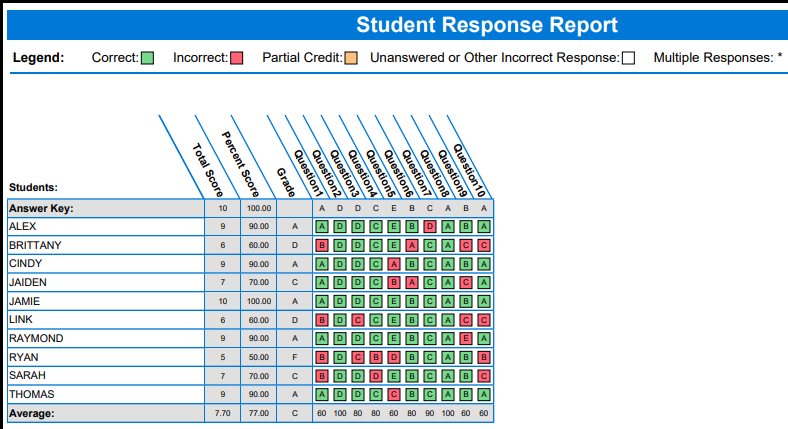
Student Response Report
The Student Response Report provides a class view of all test responses by student and by question. It provides visual insight to both student and question performance. Below are listed aspects of the report:
- The students are listed down the left side of the report. The questions are listed across the top of the report.
- Each student’s answer to each graded question is listed within a colored box: green for correct responses and red for incorrect responses. A white empty box means the student left the question blank or entered an invalid response (e.g., multiple responses when multiple responses are not allowed).
- Between the student’s name and answer, the report total score, percent score, grade and scaled score (if applicable) are listed.
- At the bottom of the report the percentage of students who answered the question correctly is listed, as well as averages for the total score, percent score, and grade.
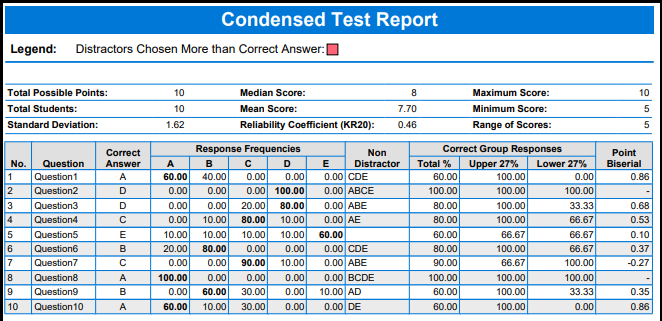
Condensed Test Report
The Condensed Test report provides a summary of basic tests statistics. The header optionally contains statistical information about the test results. The body of the report shows each question, its response frequency, distractor information, group responses and the point biserial calculation.
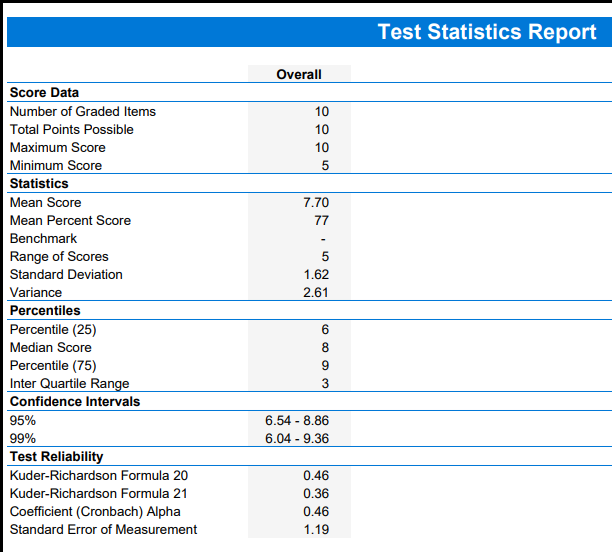
Test Statistics Report
The Test Statistics Report displays descriptive statistics about the overall test as well as each learning objective, if applicable. If there are subjective questions on the test, a breakdown of statistics for the overall test, objective items and subjective items is displayed.
There are a few items at the end of the report that may be unknown terms. Here are some descriptions:
- Percentile (25 and 75) – values that divide a sample of data into one hundred groups containing (as far as possible) equal numbers of observations. For example, 25% of the data values lie below the 25th percentile.
- Inter Quartile Range – The difference between the 75th percentile and the 25th percentile.
- Confidence Intervals (95, 99%) – A confidence interval gives an estimated range of values that is likely to include an unknown population parameter, the estimated range being calculated from a given set of sample data. If independent samples are taken repeatedly from the same population, and a confidence interval calculated for each sample, then a certain percentage (confidence level) of the intervals includes the unknown population parameter.
The below terms will likely not be used for any exam scored through our services, and descriptions are provided merely for explanation of a value present on our provided reports.
- Kuder-Richardson Formula 20 – This formula measures test reliability and is an overall measure of internal consistency. A higher value indicates a stronger relationship between items on the test.
- Kuder-Richardson Formula 21 – This formula measures test reliability and is an overall measure of internal consistency. A higher value indicates a stronger relationship between items on the test.
- Coefficient (Cronbach) Alpha – A coefficient that describes how well a group of items focuses on a single idea or construct.